prometheus 를 이용해서 모니터링을 할때 필요한 windows_exporter
설치 방법
1. 홈페이지에서 자료를 다운로드 한다
https://github.com/prometheus-community/windows_exporter
https://github.com/prometheus-community/windows_exporter/releases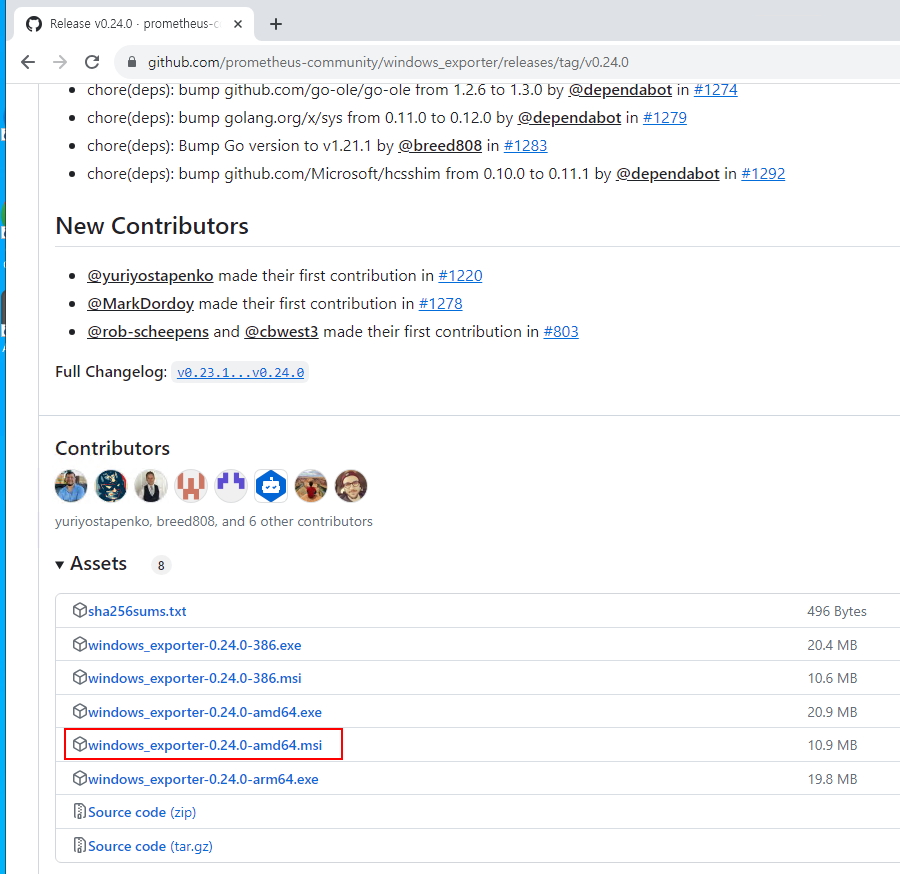
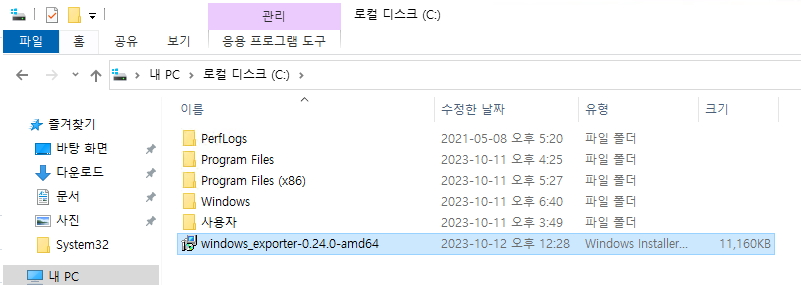
해당 파일을 다운로드 하여 c:\ 이동을 한다
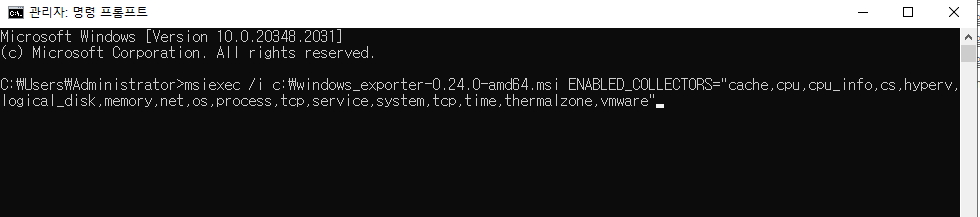
cmd -> 관리자권한 실행 / install
|
1 |
msiexec /i c:\windows_exporter-0.24.0-amd64.msi ENABLED_COLLECTORS="cache,cpu,cpu_info,cs,hyperv,logical_disk,memory,net,os,process,tcp,service,system,tcp,time,thermalzone,vmware" |
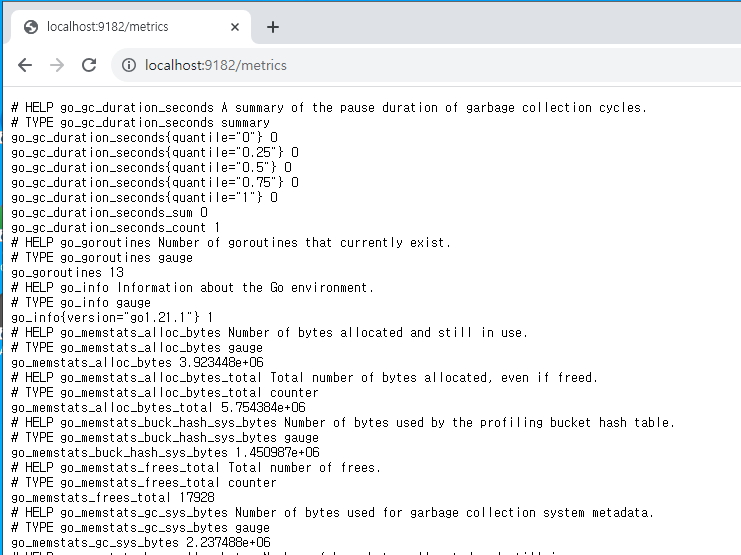
웹페이지에서 확인
이제 prometheus 에 등록 ( prometheus server에서 작업)
|
1 2 3 4 5 |
[root@xinet ~]# vi /usr/local/prometheus/prometheus.yml - job_name: "xinet_windows" static_configs: - targets: ["192.168.0.200:9182"] |
prometheus 재시작
|
1 |
[root@xinet ~]# systemctl restart prometheus |
Grafana에서 대시보드 추가 https://grafana.com/grafana/dashboards/14694-windows-exporter-dashboard/
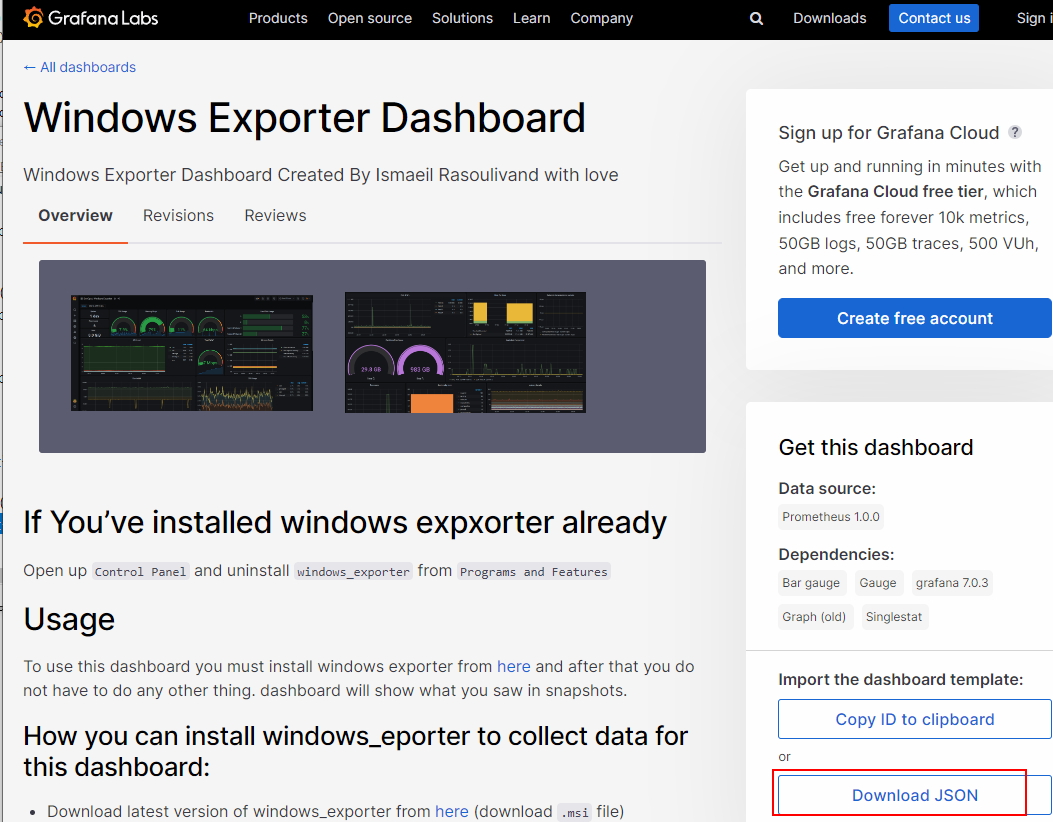 json 파일은 다운로드
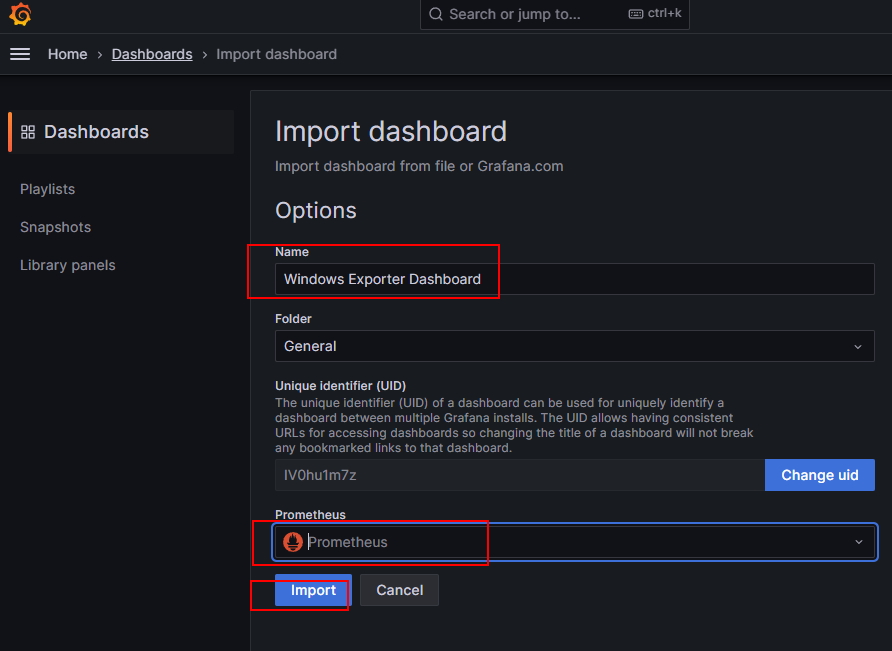
다운로드 한 json 파일을 대시보드에 import
Dashboards -> import ->
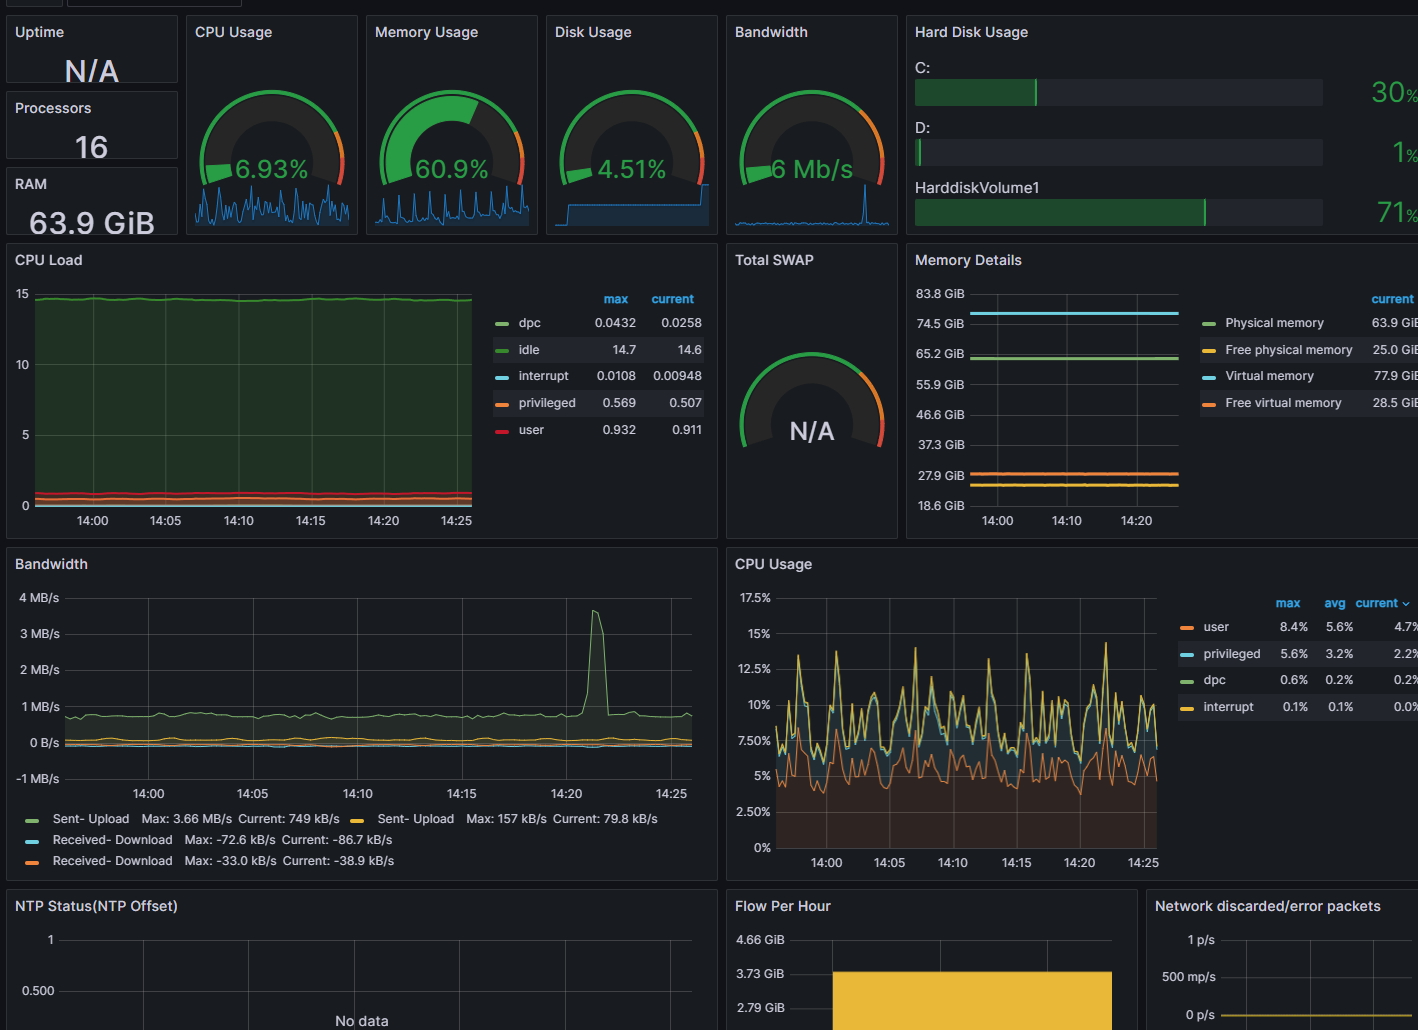
이제 Grafana 대시보드에서 확인
좀더 자세한 옵션 사용 install 내용은
https://github.com/prometheus-community/windows_exporter